|
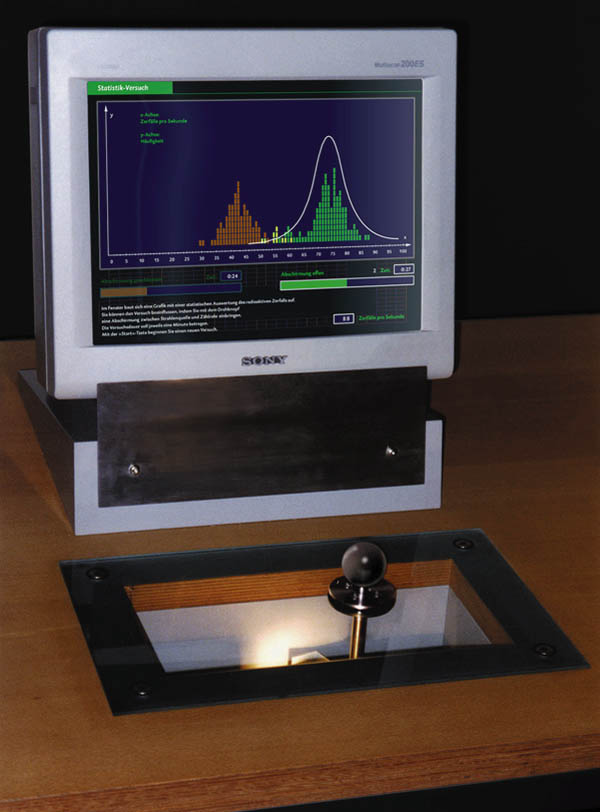
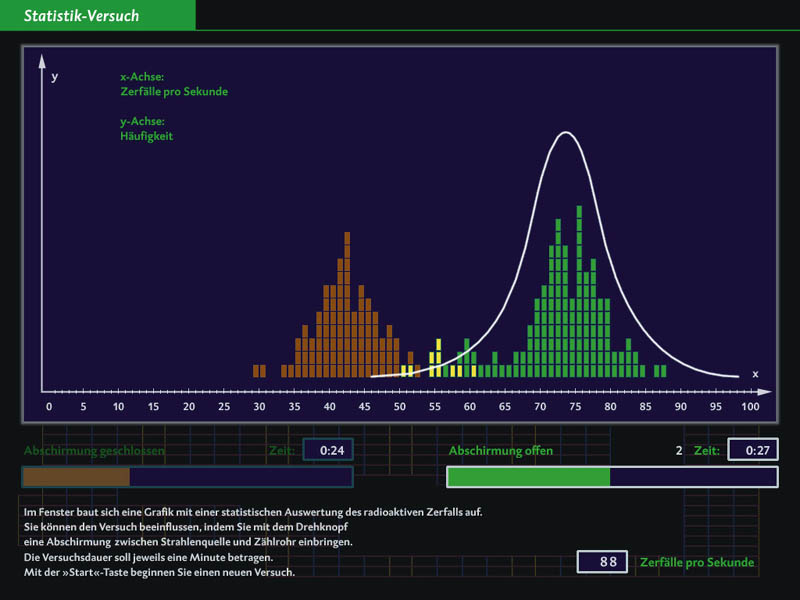
Visitors using this exhibit can measure the behavior of radioactive decomposition. After a short time they can see how a natural distribution (bell) curve is built up on the monitor. The results are shown on the diagram ( x axis: decompositions per second, y axis: frequency) and in addition the computer draws the resulting curve over the bars.
Users can place a barrier between the source and the counter so that the rate is roughly halved and observe how the building of the curve is displaced along the x axis. The position of the barrier is checked by the computer and the respective timer (and time display) is activated. A complete experiment lasts 60 seconds per position, so two minutes in total. At the end of this time, the two curves can be compared. One can change the barrier position at any time without hindering the experiment.
The exhibit is self calibrating (once a day) and it has an automatic
time out that turns the lamp in the experiment chamber off and switches
a screen saver on, if the exhibit doesn´t register any user activity
for 3 minutes after a trial is run. Built in 1999, for the Technical
Museum, Vienna.
|